

Web-ready professional article with charts and tables | based exclusively on official data from the Labour Office of the Czech Republic and the Ministry of Labour and Social Affairs
| Executive summary March 2026 brought the first visible spring easing in the Czech labour market. The share of unemployed persons fell to 5.0%, the number of registered jobseekers declined by 9,367 month on month, and the number of registered vacancies rose again. Year on year, however, conditions remain weaker: there were 50,198 more jobseekers in the register than a year earlier. For employers and candidates alike, the takeaway is clear: the labour market improved in March, but not across the board and not at the same pace in every region. |
| Key findings • The share of unemployed persons fell from 5.2% in February to 5.0% in March. • The Labour Office recorded 372,338 jobseekers and 91,545 vacancies. • A total of 40,001 people moved into work in March; 42,131 were newly registered. • The highest unemployment rates were recorded in the Usti nad Labem Region (7.5%) and the Moravian-Silesian Region (7.0%). • The most challenging districts remained Karvina (10.4%) and Most (10.3%). |
1. Unemployment eased in March as seasonal spring hiring returned
March confirmed the usual spring turning point. After rising to 5.1% in January and 5.2% in February, the share of unemployed persons fell to 5.0% in March. In absolute terms, that meant 9,367 fewer registered jobseekers than in February.
The trend is encouraging, but it does not amount to a return to last year’s conditions. In March 2025, the share of unemployed persons stood at 4.3% and the Labour Office recorded 322,140 jobseekers. Compared with a year ago, this year’s March remains weaker both in unemployment levels and in the absolute number of people without work.
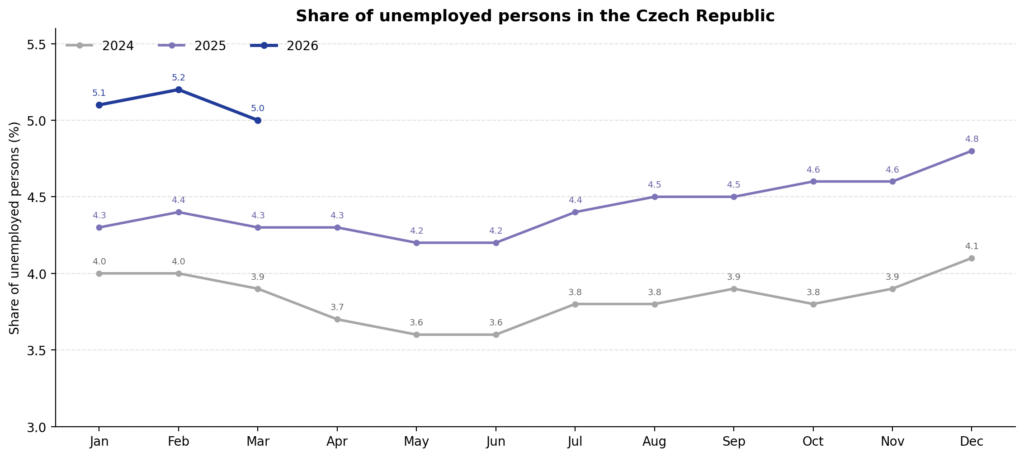
Chart 1. Share of unemployed persons in the Czech Republic. Source: Labour Office of the Czech Republic, January, February and March 2026 press releases.
Table 1. Key labour market indicators
| Indicator | 03/2026 | 02/2026 | 03/2025 | Comment |
| Share of unemployed persons | 5.0% | 5.2% | 4.3% | Month on month: -0.2 pp; year on year: +0.7 pp |
| Registered jobseekers | 372,338 | 381,705 | 322,140 | Month on month: -9,367; year on year: +50,198 |
| Registered vacancies | 91,545 | 89,705 | 91,752 | Month on month: +1,840; year on year: -207 |
| Newly registered jobseekers | 42,131 | 43,108 | 36,073 | Month on month: -977; year on year: +6,058 |
| People moving into work | 40,001 | 30,033 | — | A much stronger outflow into employment than in February |
| Recipients of unemployment benefits | 104,545 | 111,872 | 91,572 | Their share of all jobseekers fell to 28.1% |
| Spending on benefits and retraining | CZK 2.087 bn | CZK 1.773 bn | — | Higher than in February |
2. More people moved into work, and vacancies increased again
During March, 42,131 people newly registered with the Labour Office, while 51,498 left the register. Of those leaving, 40,001 moved into new employment. That is a materially stronger result than in February, when 30,033 people found work.
At the same time, the number of registered vacancies rose again. By the end of March, the Labour Office was advertising 91,545 vacancies, up by 1,840 compared with February. According to the Labour Office, the strongest growth in new openings was seen in education, accommodation and food services, and activities provided through employment agencies.
The Labour Office also explicitly notes that its vacancy register does not cover the entire labour market. Many positions are filled outside this database through direct hiring, job boards or social media. Vacancy statistics should therefore be read as an important indicator of labour demand, but not as a complete picture of the market.
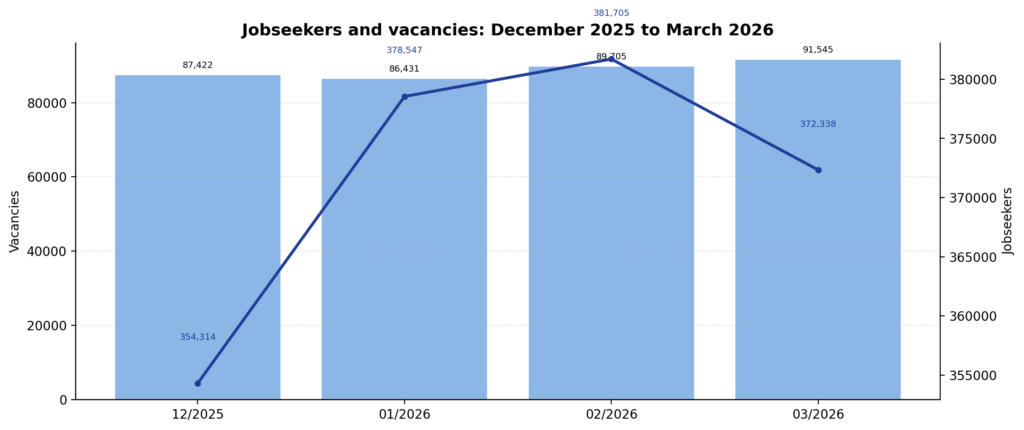
Chart 2. Jobseekers and registered vacancies from December 2025 to March 2026. Source: Labour Office of the Czech Republic.
3. The regional picture: the Czech Republic does not have one labour market, but several
The highest share of unemployed persons in March remained in the Usti nad Labem Region at 7.5%, followed by the Moravian-Silesian Region at 7.0%. At the other end of the scale were Prague at 3.8% and the Plzen and Pardubice Regions, both at 4.1%.
Unemployment declined month on month in 13 of the 14 regions. The steepest drop was recorded in the Vysocina and South Bohemian Regions, both by 0.3 percentage points. In the Moravian-Silesian Region, the share of unemployed persons remained unchanged from February.
For employers, this means the national headline figure of 5.0% is useful, but not sufficient for hiring decisions. Labour availability, wage pressure and time to fill roles still vary markedly from one region to another.
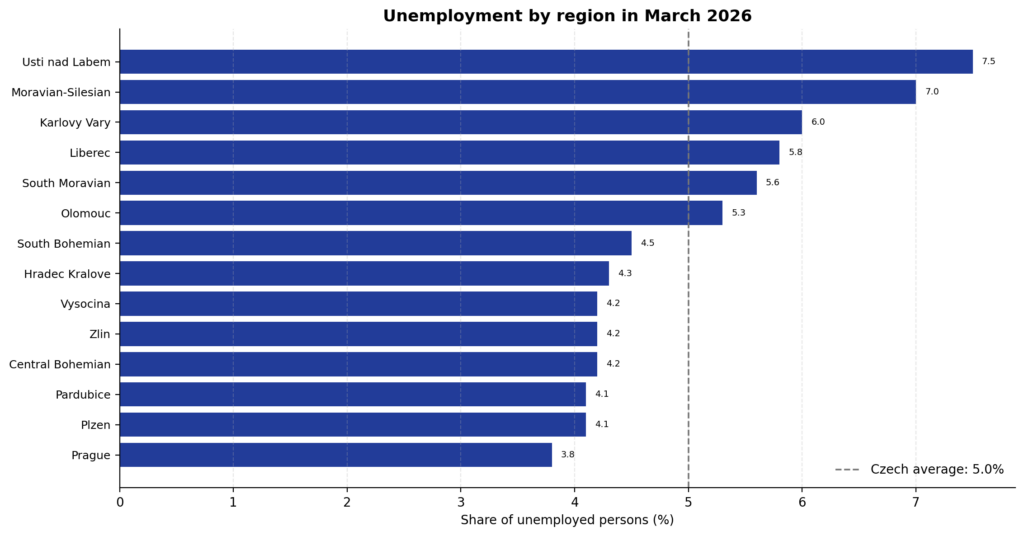
Chart 3. Share of unemployed persons by region in March 2026. The dashed line marks the Czech average of 5.0%. Source: Labour Office of the Czech Republic.
Table 2. Regional comparison
| Region | 03/2026 | 03/2025 | Year-on-year change |
| Prague | 3.8% | 3.0% | +0.8 pp |
| Plzen | 4.1% | 3.6% | +0.5 pp |
| Pardubice | 4.1% | 3.5% | +0.6 pp |
| Central Bohemian | 4.2% | 3.5% | +0.7 pp |
| Zlin | 4.2% | 3.6% | +0.6 pp |
| Vysocina | 4.2% | 3.6% | +0.6 pp |
| Hradec Kralove | 4.3% | 3.7% | +0.6 pp |
| South Bohemian | 4.5% | 3.9% | +0.6 pp |
| Olomouc | 5.3% | 4.7% | +0.6 pp |
| South Moravian | 5.6% | 4.9% | +0.7 pp |
| Liberec | 5.8% | 4.8% | +1.0 pp |
| Karlovy Vary | 6.0% | 5.3% | +0.7 pp |
| Moravian-Silesian | 7.0% | 6.0% | +1.0 pp |
| Usti nad Labem | 7.5% | 6.6% | +0.9 pp |
4. District-level extremes: Karvina, Most and heavy pressure on each vacancy
At district level, the most difficult labour market conditions remained in Karvina at 10.4% and Most at 10.3%, followed by Bruntal at 8.7% and the districts of Chomutov and Sokolov, both at 8.0%.
The lowest unemployment levels were again recorded in the Prague-East and Prague-West districts, which together stood at 1.9%, and in Rychnov nad Kneznou at 2.8%.
Across the Czech Republic, there were 4.1 registered jobseekers per vacancy on average. In Karvina, however, the ratio reached 20.9; in Sokolov, 18.7; and in Decin, 15.2. These figures show that the number of vacancies alone is not enough; what matters just as much is their regional distribution and sector mix.
Table 3. Selected district extremes
| Highest unemployment | Lowest unemployment | Most jobseekers per vacancy |
| Karvina – 10.4% | Prague-East and Prague-West – 1.9% | Karvina – 20.9 |
| Most – 10.3% | Rychnov nad Kneznou – 2.8% | Sokolov – 18.7 |
| Bruntal – 8.7% | Zlin – 3.5% | Decin – 15.2 |
| Chomutov – 8.0% | Pelhrimov – 3.5% | Bruntal – 12.7 |
| Sokolov – 8.0% | Mlada Boleslav – 3.6% | Usti nad Labem – 12.4 |
5. What the March numbers mean for employers
For employers, the March statistics are positive in one important respect: candidate activity increased after the winter and more positions were filled. At the same time, the data does not point to broad-based easing. Unemployment remains higher than a year ago, and regional disparities are still pronounced.
Three practical conclusions follow for workforce planning. First, the national average needs to be complemented by a regional and district-level view. Second, candidate availability depends not only on unemployment levels, but also on the ratio of jobseekers to each vacancy. Third, the Labour Office’s vacancy register captures only part of real employer demand, so it should always be combined with first-hand market knowledge.
The March decline to 5.0% should therefore be read as confirmation of seasonal spring recovery, not as a sign that recruitment pressure has materially eased across the country.
| Methodological note The Ministry of Labour and Social Affairs and the Labour Office of the Czech Republic use the indicator ‘share of unemployed persons’, defined as the share of reachable jobseekers aged 15–64 in the total population of the same age. This is not the same indicator that Eurostat uses for international comparisons of unemployment. |